Why Multi-Touch Attribution Matters
Most marketers still rely on last-click attribution. This means you’re giving 100% of the credit to the final interaction before conversion - completely ignoring the 5-10 touchpoints that actually built the customer’s intent to buy.
The result? You over-invest in bottom-funnel channels (branded search, retargeting) and under-invest in top-funnel campaigns (awareness, prospecting) that actually drive growth. An effective marketing attribution software solves this by mapping every touchpoint in the customer journey.
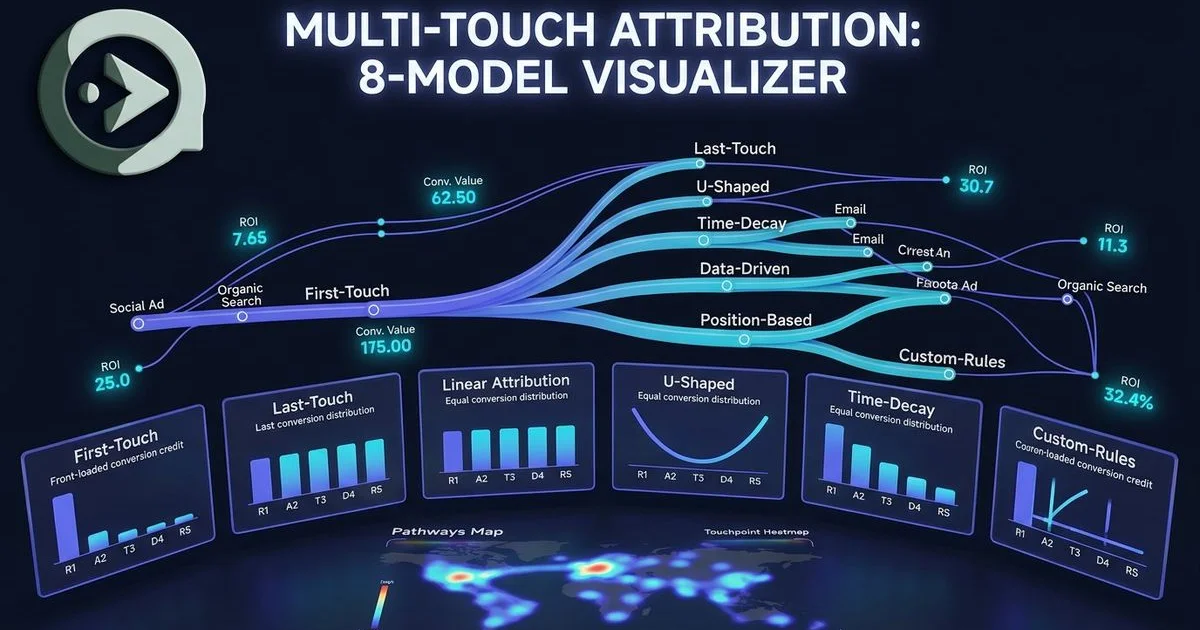
8 Attribution Models Explained
Single-Touch Models
First Touch assigns all credit to the first interaction. Use this to understand which channels are best at introducing new prospects to your brand.
Last Touch assigns all credit to the final interaction. Useful for understanding which channels close deals, but misleading when used alone.
Multi-Touch Models
Linear distributes credit equally across all touchpoints. This is the most “democratic” model and works well as a baseline comparison.
Time Decay gives progressively more credit to touchpoints closer to the conversion. Best for businesses with short buying cycles where recency matters.
Position-Based (40/20/40) gives 40% credit to the first touch, 40% to the last touch, and splits the remaining 20% among middle touchpoints. This is often the best starting point for most businesses.
U-Shaped uses a 40/20/40 split similar to Position-Based, giving 40% credit to the first touch, 40% to the last touch, and distributing the remaining 20% across middle touchpoints. Use this as an alternative to Position-Based when you want to emphasize the endpoints of the customer journey.
W-Shaped adds a third emphasis point - the opportunity-creation touch. Designed for B2B companies with formal sales pipelines.
Custom Weight lets you define your own credit distribution. Experienced marketers use this to build models that reflect their specific buying cycle.
How to Choose the Right Model
| Your Situation | Recommended Model |
|---|---|
| Short buying cycle (impulse purchases) | Last Touch or Time Decay |
| Long buying cycle (considered purchases) | Position-Based or W-Shaped |
| Equal-weight baseline analysis | Linear |
| Understanding brand awareness | First Touch |
| B2B with known lead stages | U-Shaped or W-Shaped |
| Advanced, custom needs | Custom Weight |
The real power comes from comparing multiple models side by side. ONClix lets you toggle between all 8 models instantly - same data, different perspectives. See all your attribution insights alongside ad spend data in the unified ad dashboard.
Cross-Device Identity Resolution
Modern customers don’t convert on one device. They might discover your brand on mobile, research on a tablet, and purchase on desktop. ONClix uses deterministic matching (logged-in users) and probabilistic modeling (browser signals) to stitch these cross-device journeys together.
This means your attribution models work across the full customer journey, not just single-device sessions. Accurate cross-device stitching depends on reliable data collection through server-side tracking that survives browser restrictions.
Getting Started
- Connect your tracking to ONClix
- Set your lookback window (7, 14, 30, 60, or 90 days)
- View the same conversion data through all 8 models
- Identify which channels actually drive revenue - not just clicks